Build Your Web Dashboard: HTML, CSS and JavaScript Basics
Goal: understand how a website is constructed, where it can be hosted, and how it can read Google Sheets data to draw charts, preparing you for the dashboard project in the next chapter.
1. Why Learn HTML, CSS and JavaScript?
A dashboard is a web page made from three parts.
1.1 HTML: Structure
- Determines where content belongs.
- Examples include headings, paragraphs, tables and a canvas for drawing.
<h1>My Dashboard</h1>
<div id="chart"></div>1.2 CSS: Style
- Determines how the page looks.
- Controls colour, type, spacing and layout.
#chart {
    width: 600px;
    margin: 20px auto;
}1.3 JavaScript: Logic
- Provides the behaviour and interaction.
- Connects to Google Sheets through a GAS API.
- Draws charts with libraries such as Plotly.js, Chart.js or ECharts.
- Refreshes data automatically.
console.log("Dashboard Ready");2. Static and Dynamic Websites
The same dashboard can be deployed in several ways. First identify which category it belongs to.
2.1 Static Website
Characteristics:
- Consists of files such as
.html,.cssand.js. - Does not generate data itself.
- Typical hosts include GitHub Pages and a small ESP32 control page.
Suitable for display pages, scoreboards and small tools.
2.2 Dynamic Website
Characteristics:
- Retrieves data from a server or writes to a database.
- Reads data through an API, such as JSON supplied by GAS.
Your dashboard uses a hybrid model:
A static front end that retrieves data from a GAS back-end API.
3. Where Should the Dashboard Run?
3.1 On the ESP32: Not Recommended
An ESP32 can run a web server, but:
- storage may be limited to a few hundred kilobytes;
- chart libraries such as Plotly.js, Chart.js and ECharts are large;
- every front-end change requires reflashing the firmware; and
- performance is limited.
It is appropriate for a small control panel with buttons and LED switches, but not for data visualisation.
3.2 On Your Computer: VS Code + Live Server
Advantages: easiest to test, compatible with any JavaScript library, and good performance.
Disadvantages: the site stops when your computer is off and cannot conveniently be shared.
Use this during development and lessons.
3.3 On GitHub Pages, Netlify or Vercel: Recommended
Advantages: free, globally accessible and automatically redeployed after front-end changes.
Note: a static site cannot connect directly to a database, so it needs a GAS API to retrieve sheet data.
ESP32 → GAS → Google Sheet → Dashboard (JavaScript)📘 Exercise: Create Your First Local Website
Learn how HTML, CSS and JavaScript cooperate in one page. No upload or API is required.
Step 1: Create index.html
Create a project folder—for example, F5X15 XXX—and add index.html:
<style>
body {
    font-family: Arial;
    margin: 40px;
}
</style>

<script>
console.log("JS Loaded");
</script>

<h1>ESP32 Dashboard</h1>
<p>Preparing to connect to Google Sheets…</p>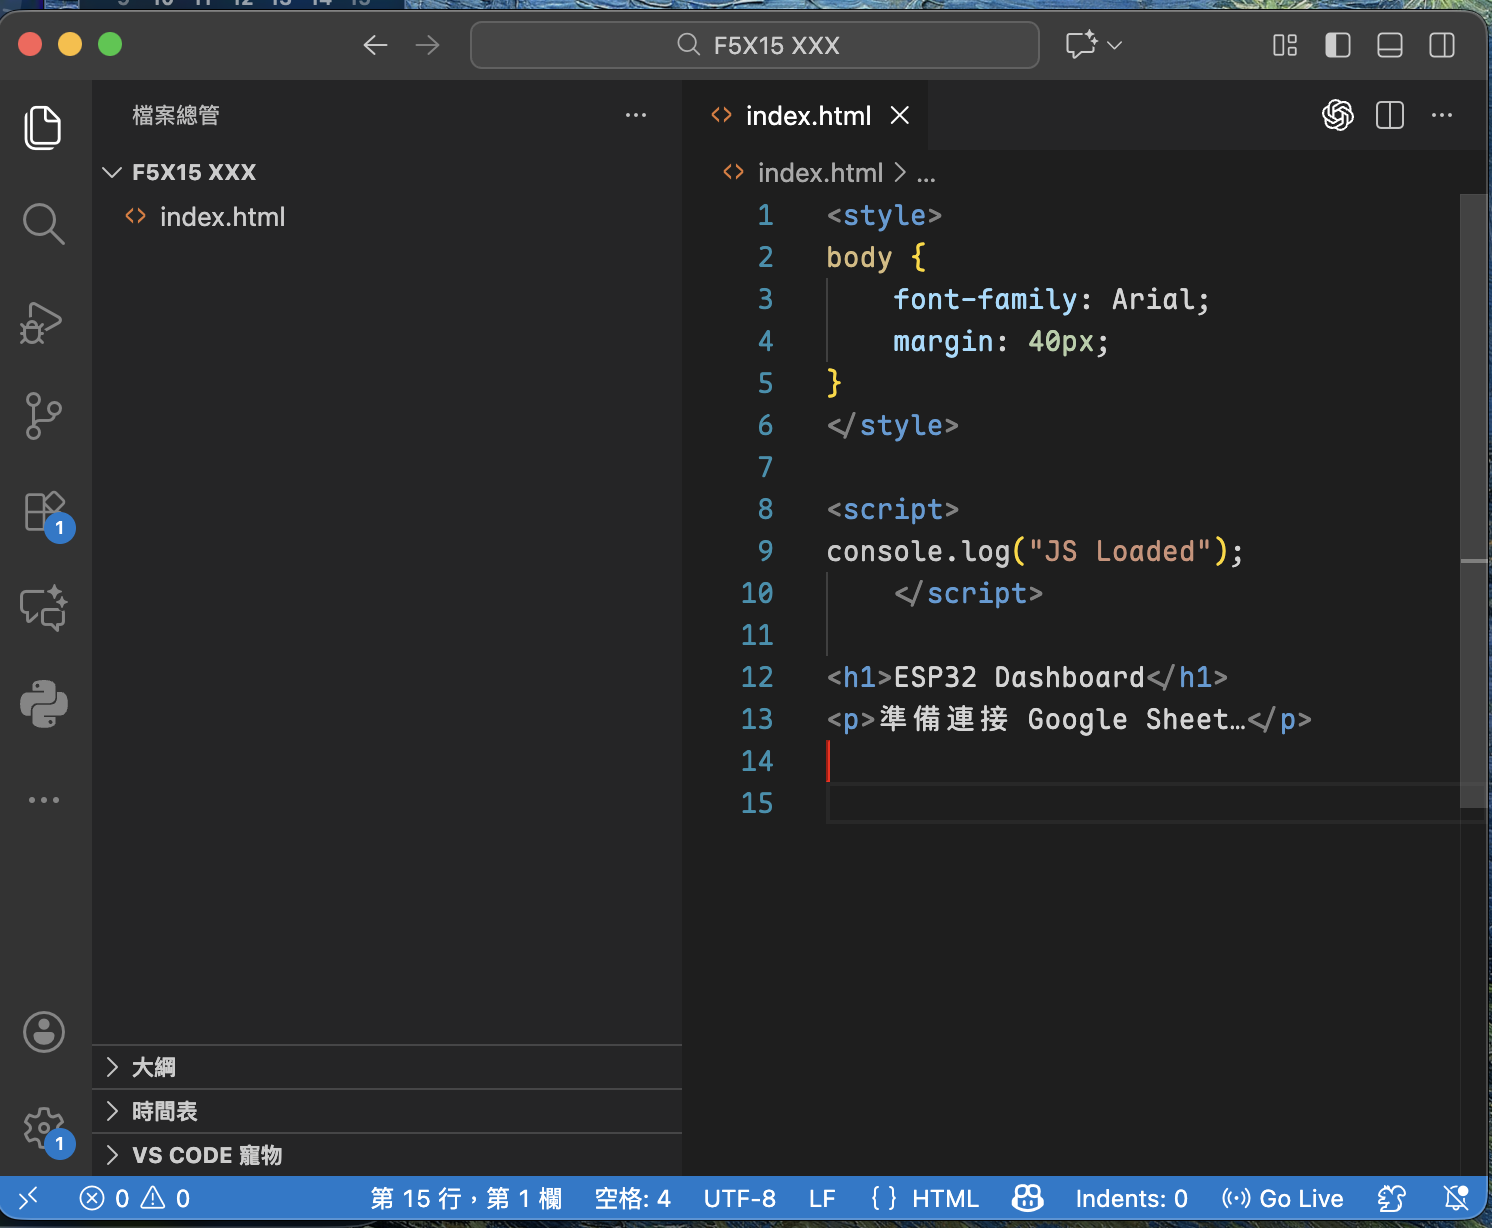
Step 2: Install Live Server
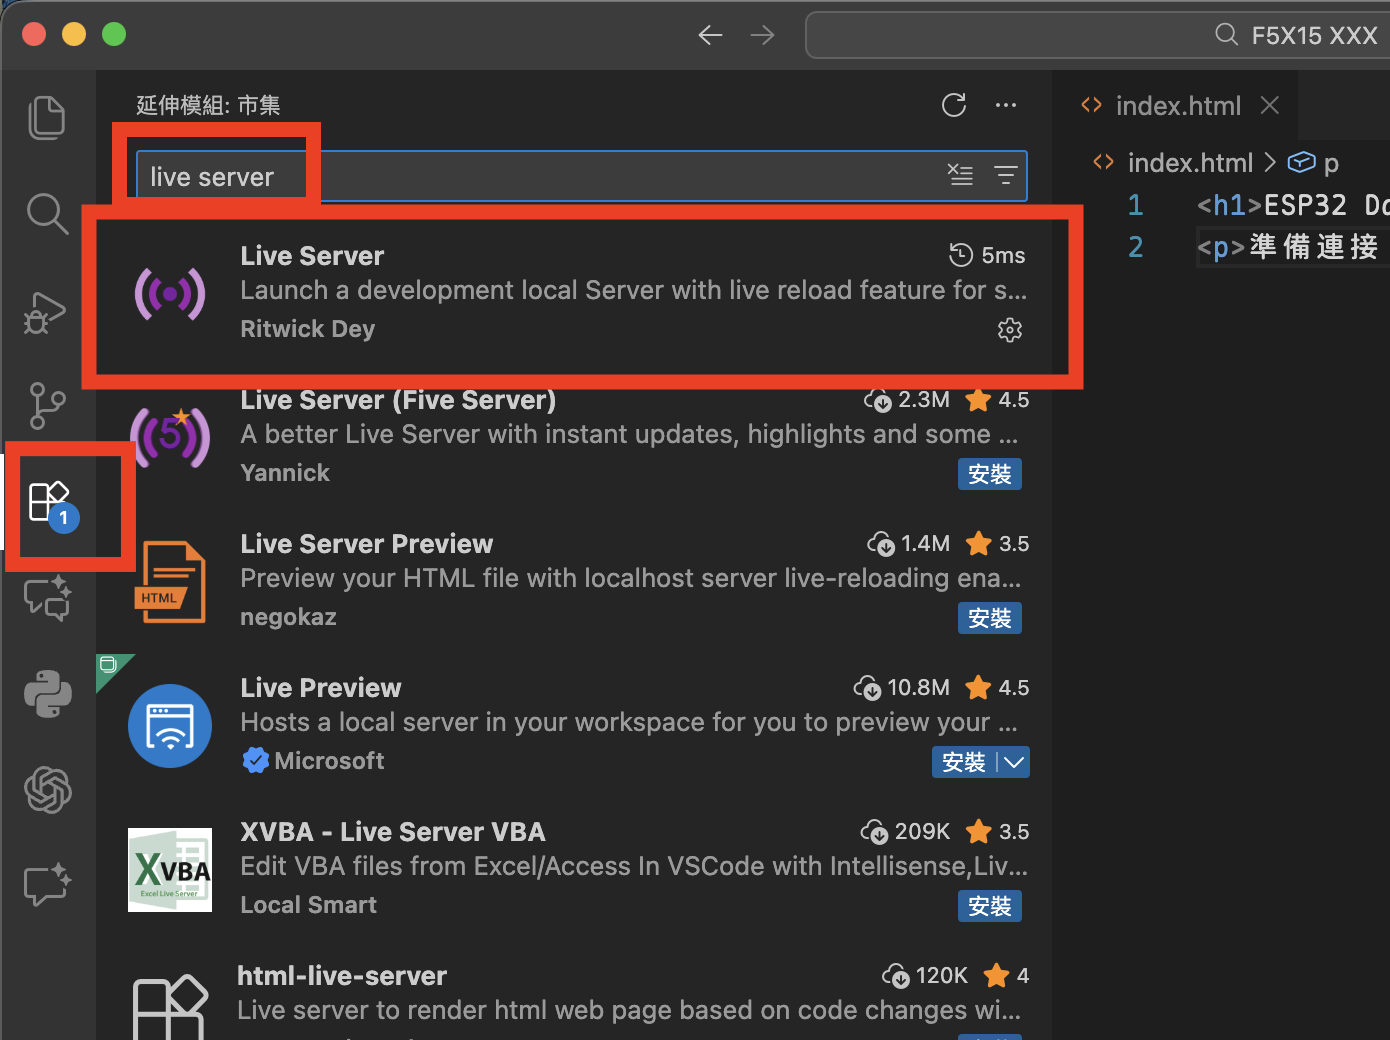
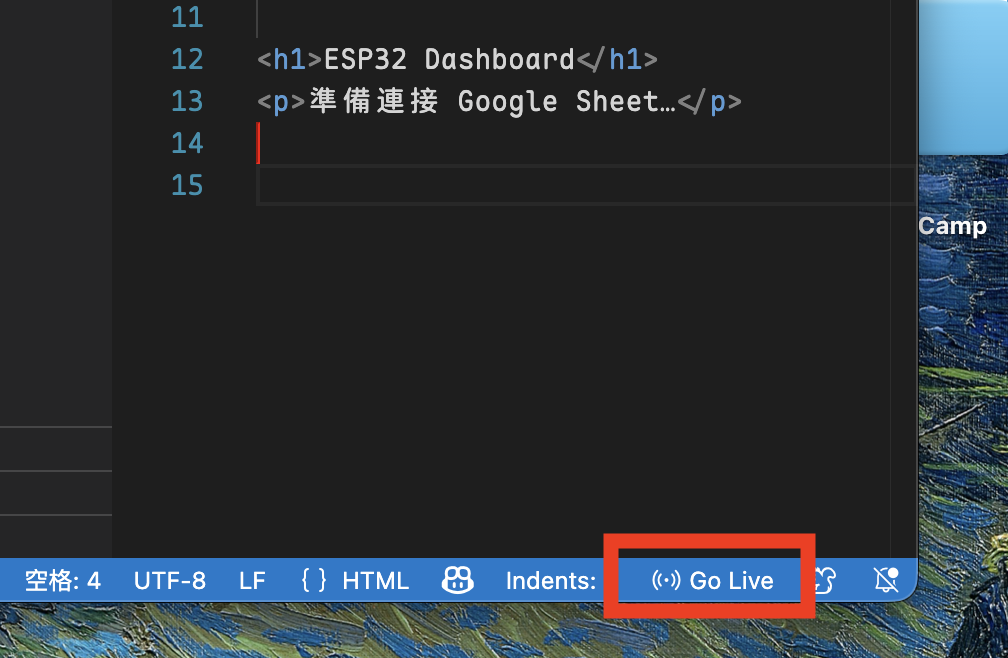
Install and start Live Server.
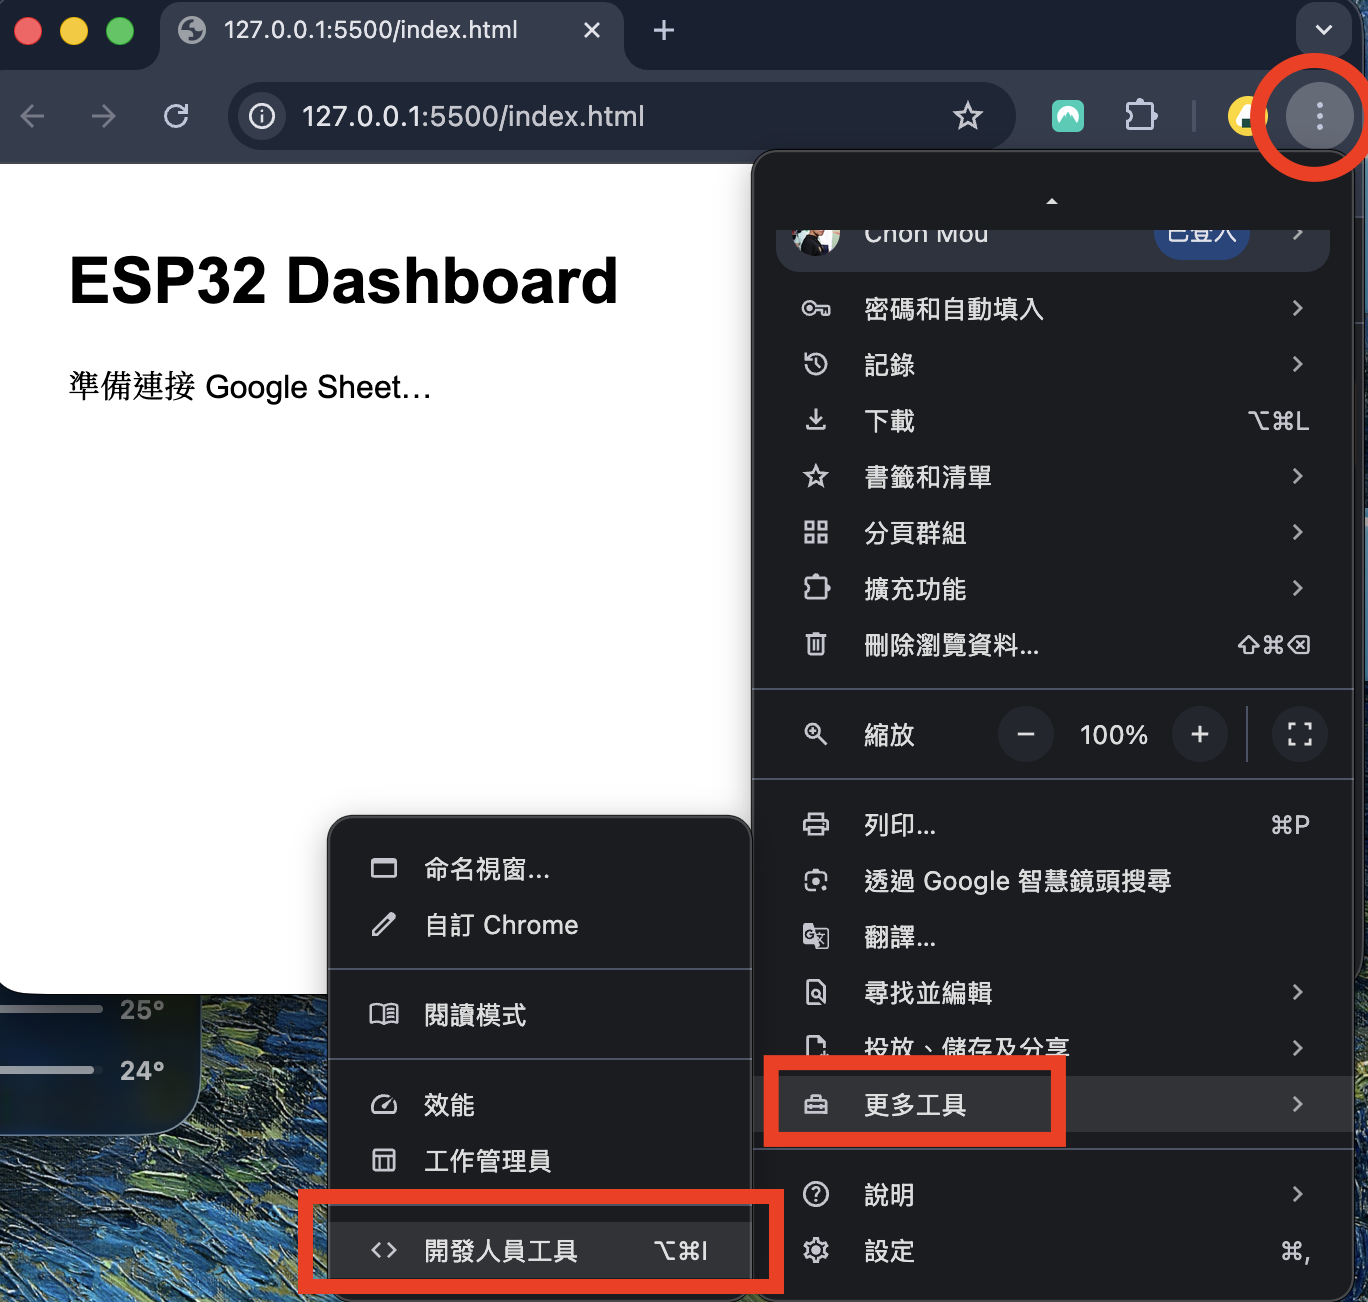
Step 3: Verify the Result
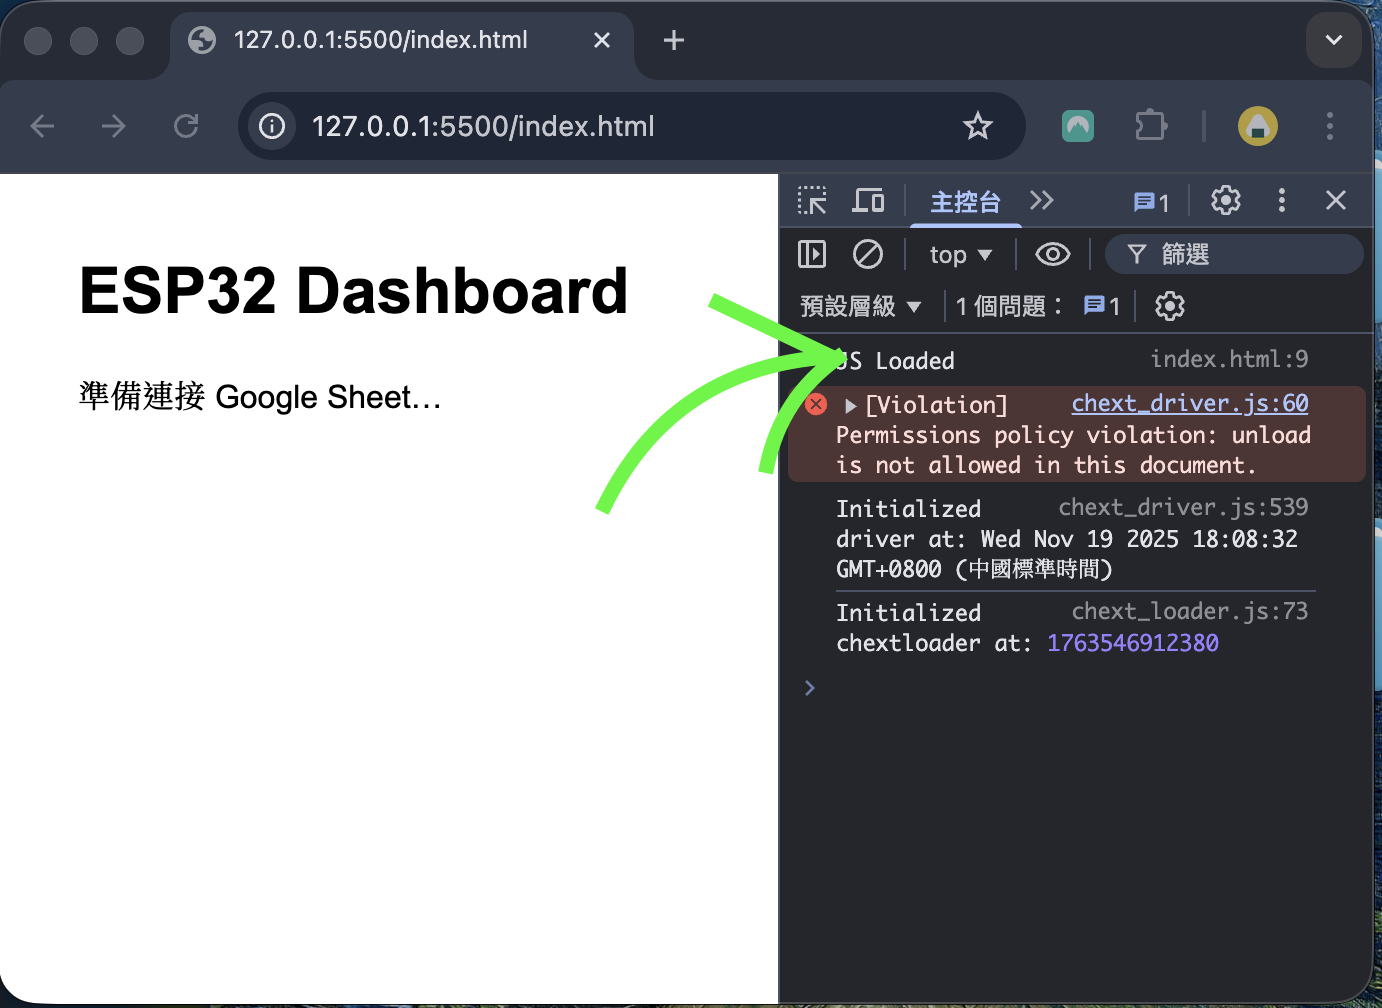
- You should see a white page with the heading.
- Open Developer Tools with
F12, select Console and verify that it saysJS Loaded.
Step 4: Organise the HTML Properly
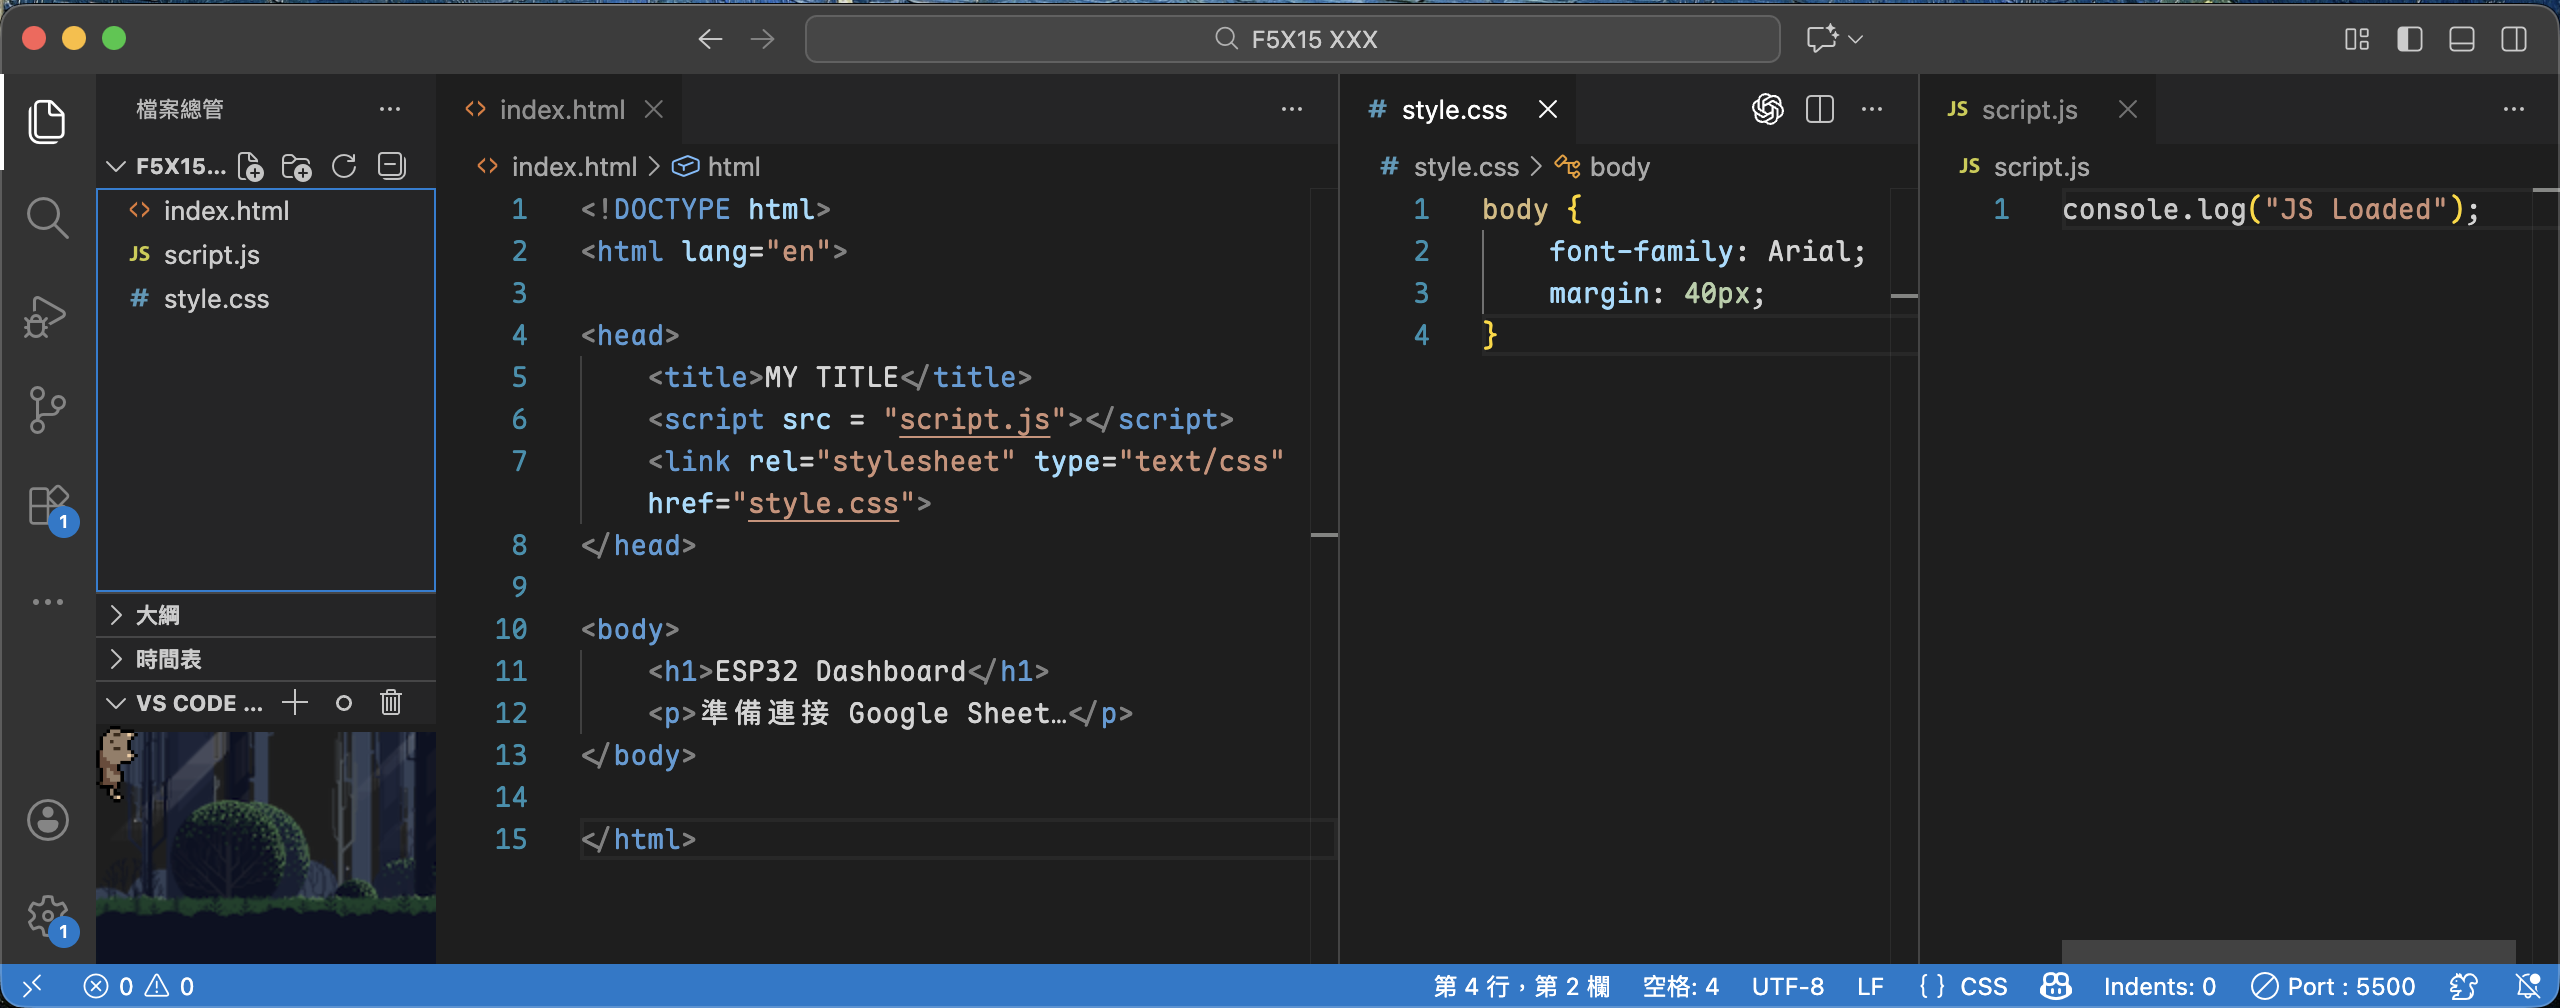
Add script.js and style.css to the project folder. Move the contents of the existing script and style blocks into the matching files, without the <script> or <style> tags.
Convert the page to a standard HTML document and reference both files in its head. In VS Code, enter html and choose the HTML5 snippet to generate the document structure.
Common HTML Elements
🔧 Exercise A: Add a Button That Changes the Page Text
Add this inside the body of index.html:
<button id="btn">Update Content</button>
<p id="result">The button has not been pressed.</p>Add this to script.js:
window.onload = () => {
    document.getElementById("btn").onclick = () => {
        document.getElementById("result").innerText = "The button was pressed!";
    };
};Key skill: DOM manipulation.
🔧 Exercise B: Add a Basic CSS Layout
Add this inside the body of index.html:
<div id="container">
    <h1>My First Web Dashboard</h1>
    <button id="btn">Click to Update</button>
    <p id="result">Waiting…</p>
</div>Add this to style.css:
#container {
    max-width: 600px;
    margin: auto;
    padding: 20px;
    border: 1px solid #ddd;
    border-radius: 12px;
}
button {
    padding: 8px 16px;
    border-radius: 6px;
    cursor: pointer;
}Key skills: CSS blocks, borders, centring and layout.
🔧 Exercise C: Add a JavaScript Calculation
Add a number field in an appropriate location:
<input id="num" type="number" placeholder="Enter a number">
<button id="add">Add</button>

<p>Current data: <span id="list">[]</span></p>
<p>Average: <span id="avg">0</span></p>Place this inside window.onload = () => { ... } in script.js. Replace the earlier btn click handler so the JavaScript does not refer to a missing or duplicate control.
let arr = [];

document.getElementById("add").onclick = () => {
    const value = Number(document.getElementById("num").value);
    arr.push(value);

    // Update the display
    document.getElementById("list").innerText = JSON.stringify(arr);

    // Calculate the average
    const avg = arr.reduce((a, b) => a + b, 0) / arr.length;
    document.getElementById("avg").innerText = avg.toFixed(2);
};You have practised arrays, DOM updates, calculation logic and immediate front-end interaction—the foundations needed for charting.
🔧 Exercise D: Turn Text into a Live Clock
Add this HTML in an appropriate location:
<p id="clock"></p>Add this JavaScript:
setInterval(() => {
    const now = new Date();
    document.getElementById("clock").innerText =
        now.toLocaleTimeString();
}, 1000);You have used setInterval(), live UI updates and time formatting. A real-time IoT chart uses the same pattern.
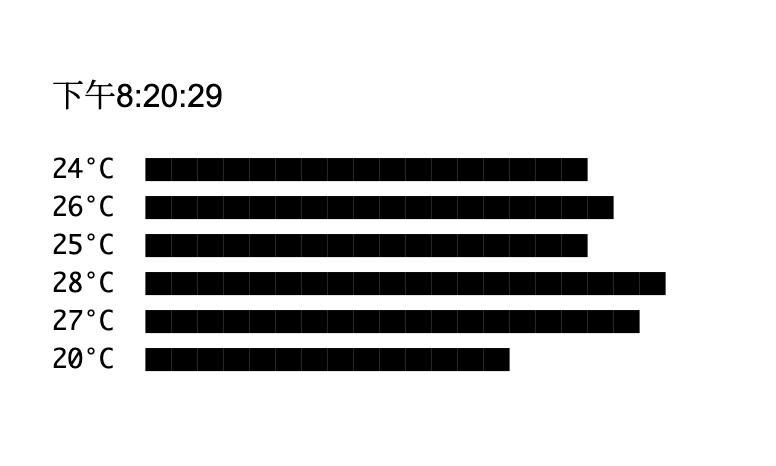
🔧 Exercise E: Draw a Mini Line Chart with Fake Data and Plain JavaScript
No Chart.js is required. Add:
<pre id="chartArea"></pre>Then add:
let fake = [24, 26, 25, 28, 27, 20];

function drawChart() {
    const max = Math.max(...fake);
    let str = "";

    fake.forEach(v => {
        const bar = "▇".repeat((v / max) * 20);
        str += `${v}°C  ${bar}\n`;
    });

    document.getElementById("chartArea").innerText = str;
}

drawChart();This turns data into a character chart. Understanding that transformation makes libraries such as Chart.js and ECharts easier to learn, while this beginner exercise has no dependency.
🔧 Exercise F: Reproduce This Result
4. Overall Dashboard Architecture
flowchart LR
    A[Sensor] --> B[ESP32]
    B --> C[HTTP POST]
    C --> D[Google Apps Script]
    D --> E[Google Sheet]

E -->|fetch| F[HTML + CSS + JavaScript<br/>Dashboard]You will:
- avoid writing a conventional back end;
- avoid building a separate database; and
- use a pure HTML/CSS/JavaScript front end that calls the GAS API.
5. Retrieve Data from Google Sheets
Open the sheet created in the previous lesson. If it contains little data, add enough sample rows to make a chart visible; an AI assistant can help generate dummy data.
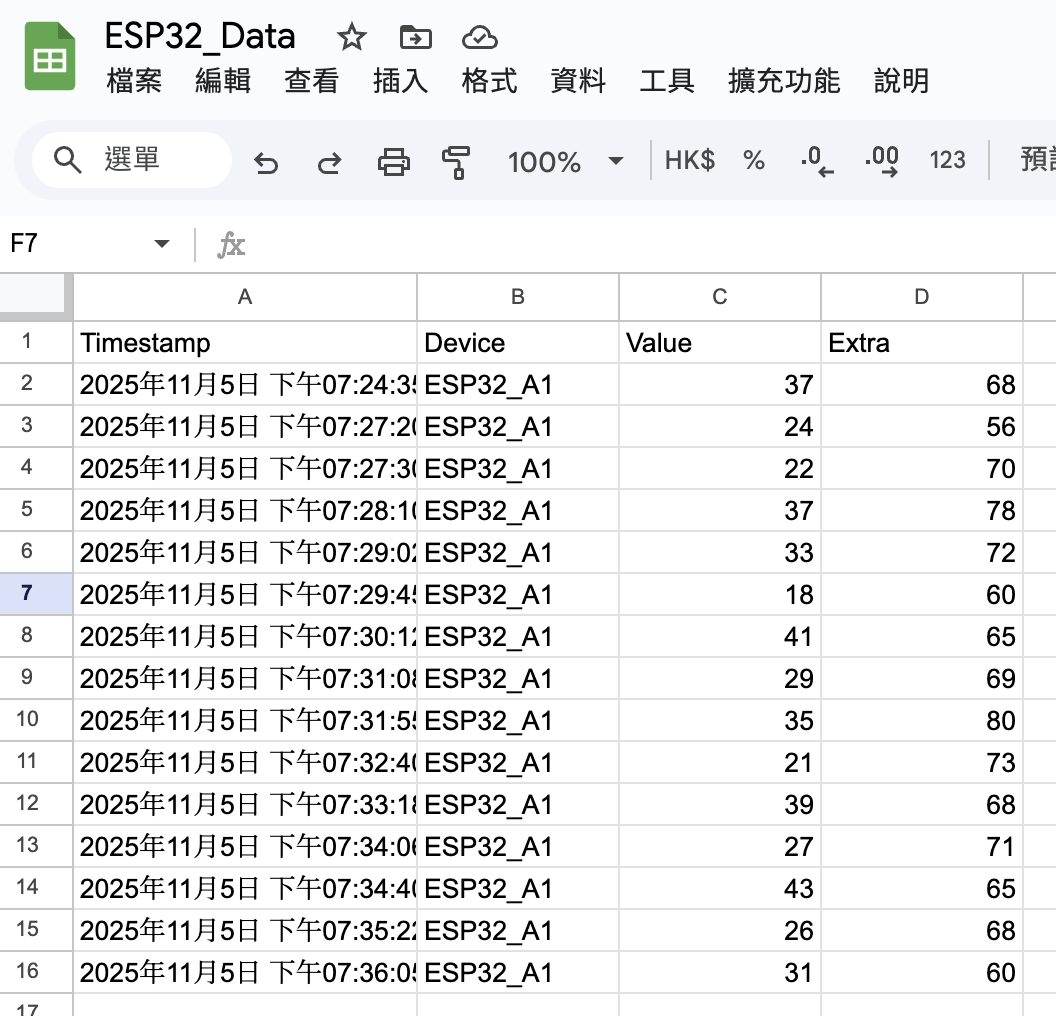
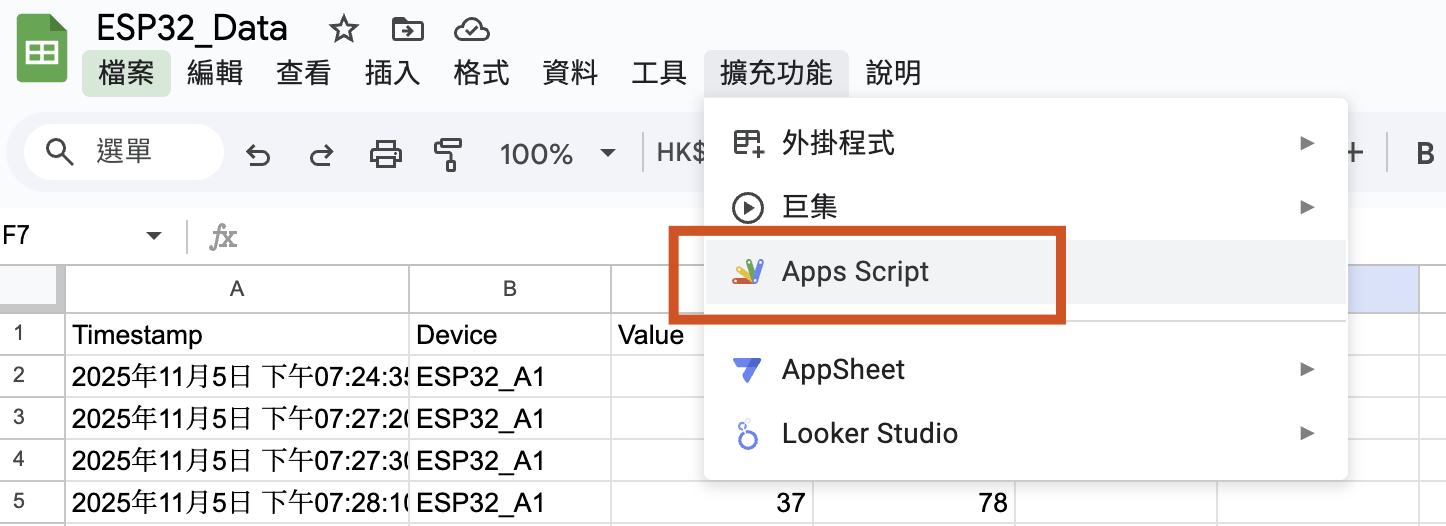
Open Extensions → Apps Script.
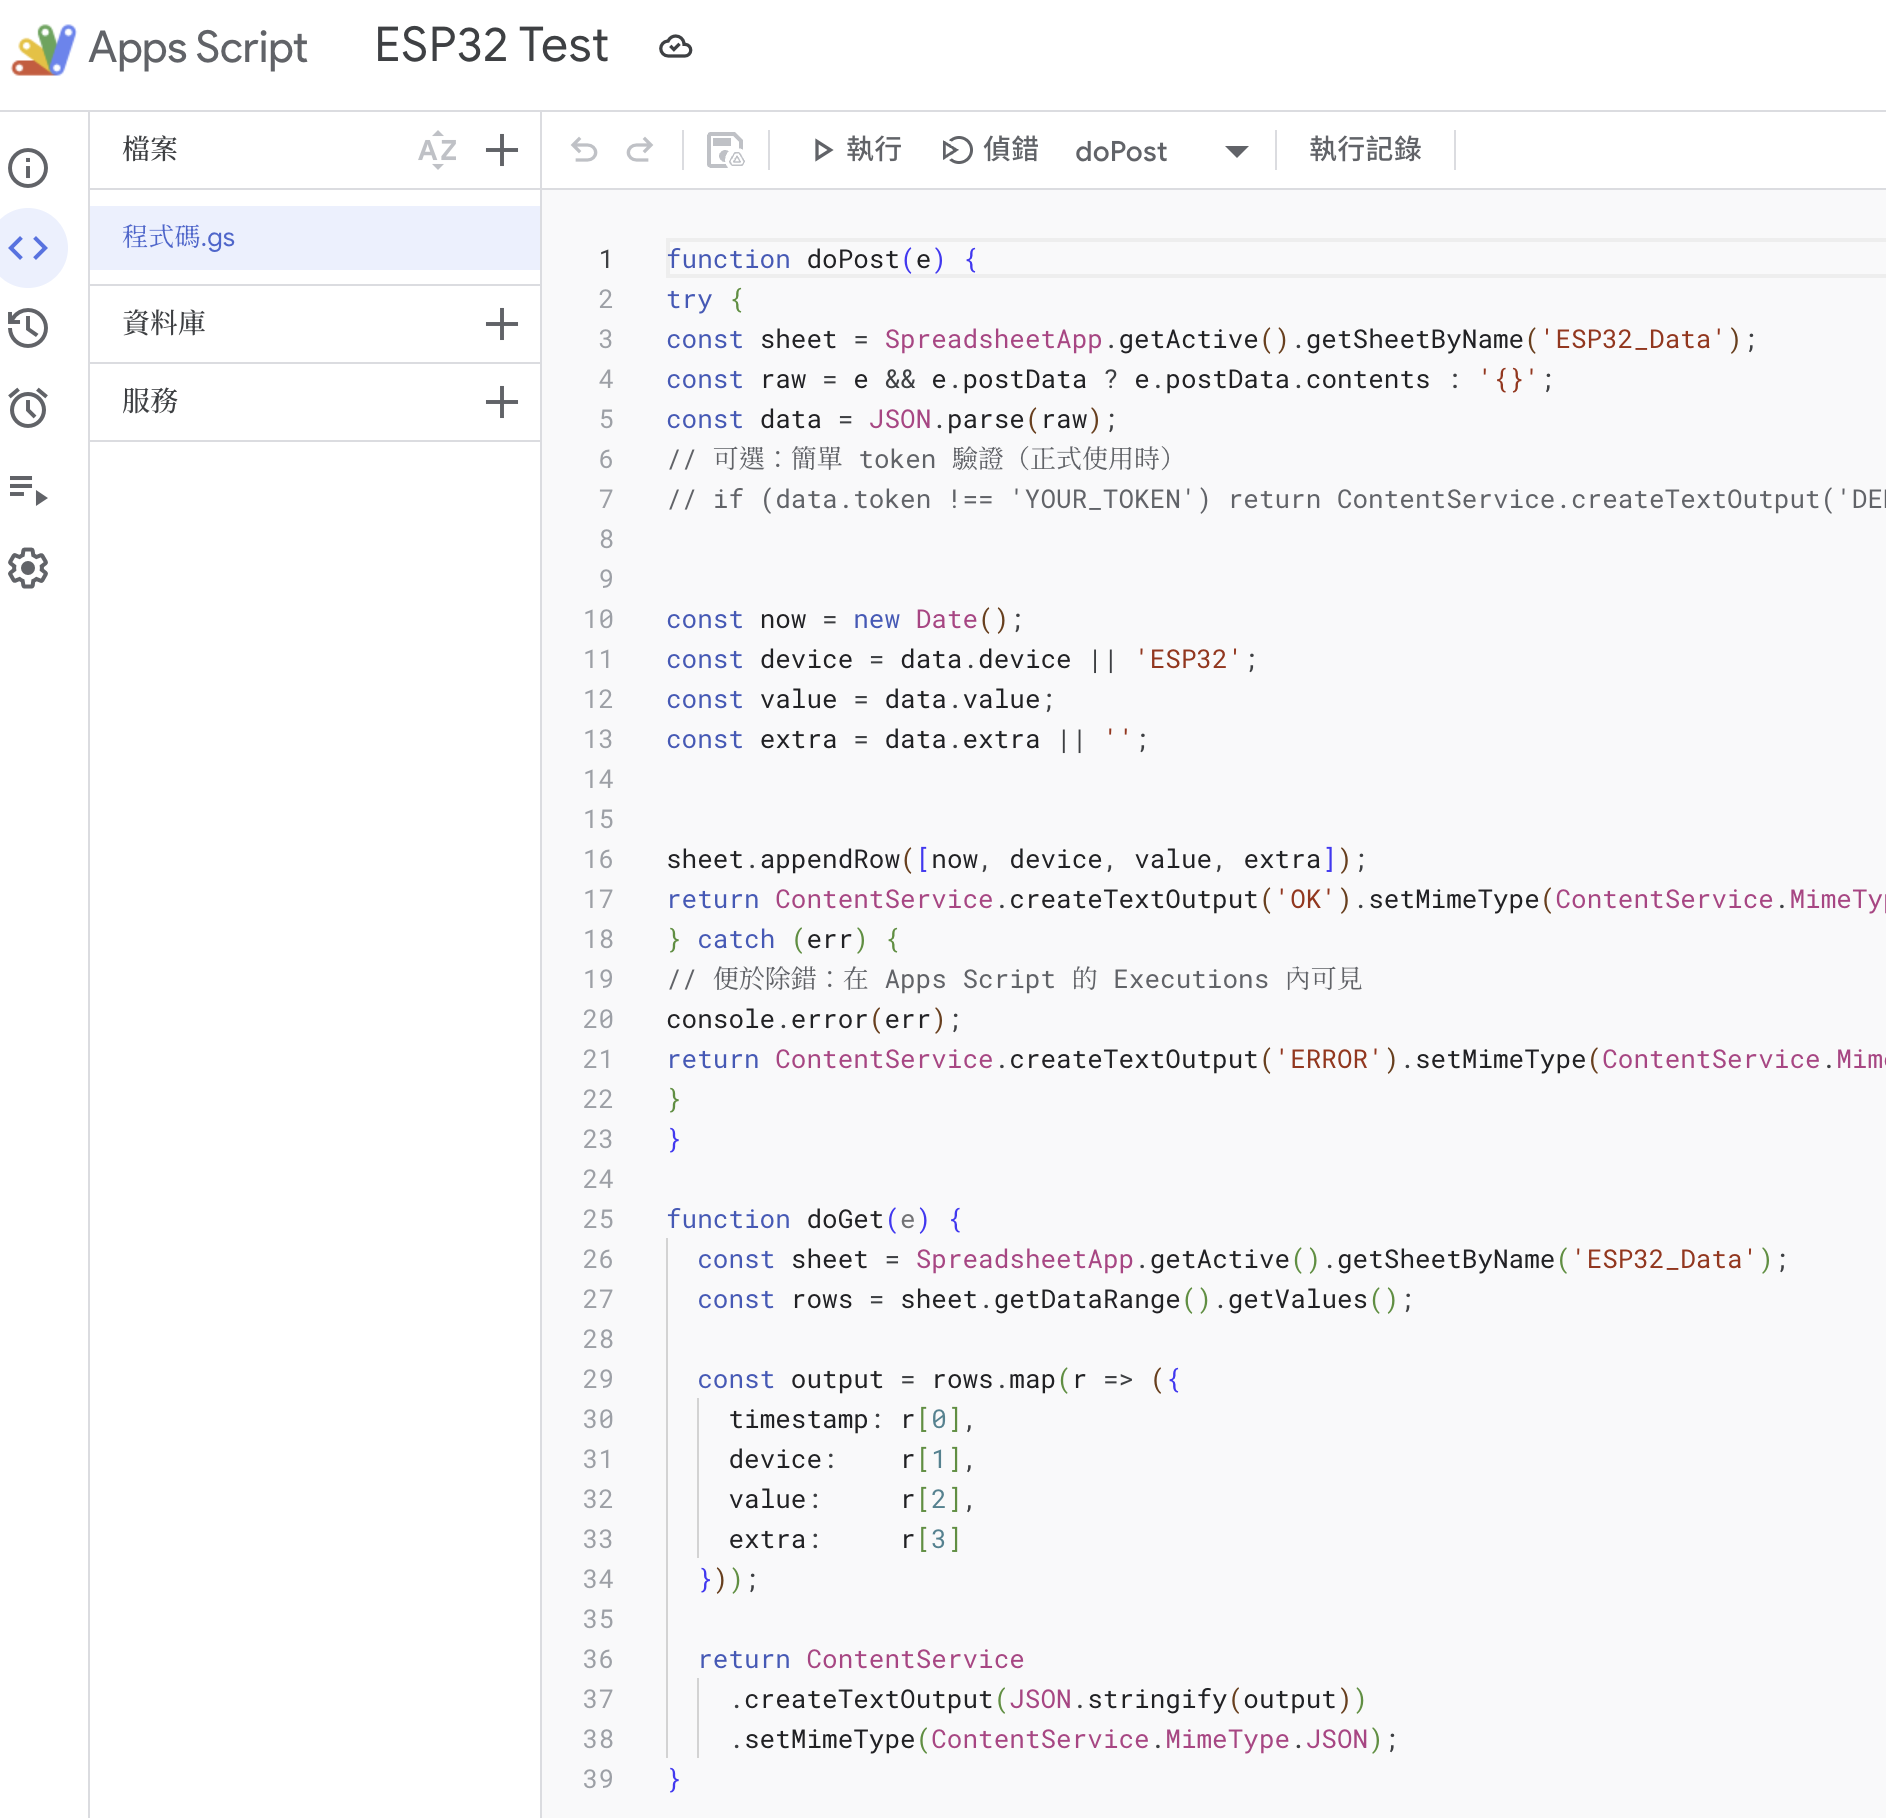
Add a doGet function alongside the existing doPost:
function doGet(e) {
  const sheet = SpreadsheetApp.getActive().getSheetByName('ESP32_Data');
  const rows = sheet.getDataRange().getValues();

  const output = rows.map(r => ({
    timestamp: r[0],
    device:    r[1],
    value:     r[2],
    extra:     r[3]
  }));

  return ContentService
    .createTextOutput(JSON.stringify(output))
    .setMimeType(ContentService.MimeType.JSON);
}
After deployment, https://script.google.com/.../exec returns the whole sheet as JSON.
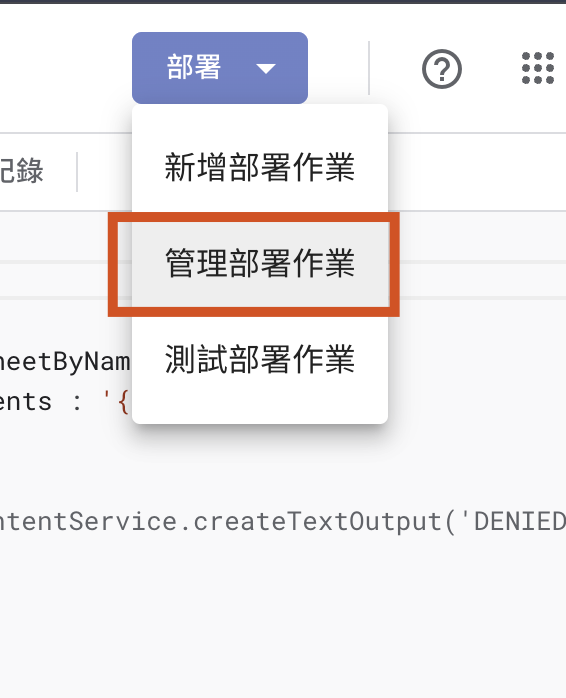
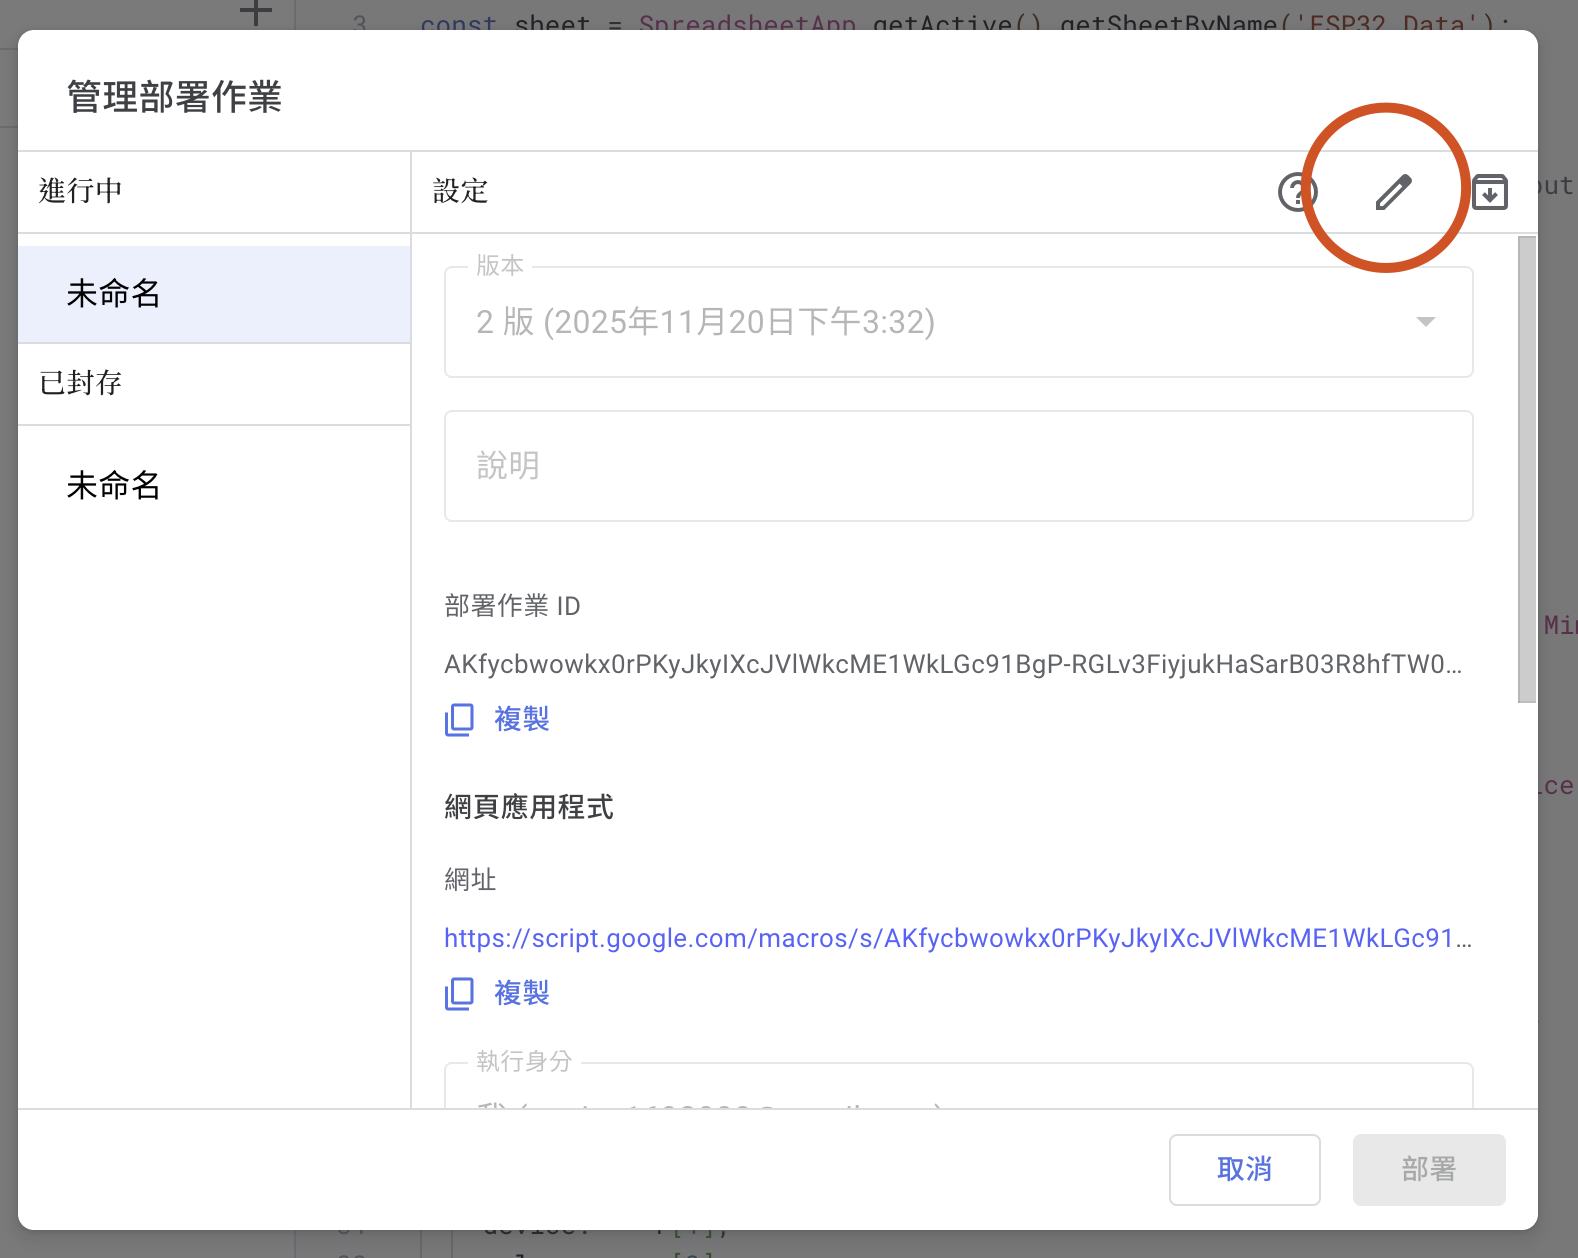
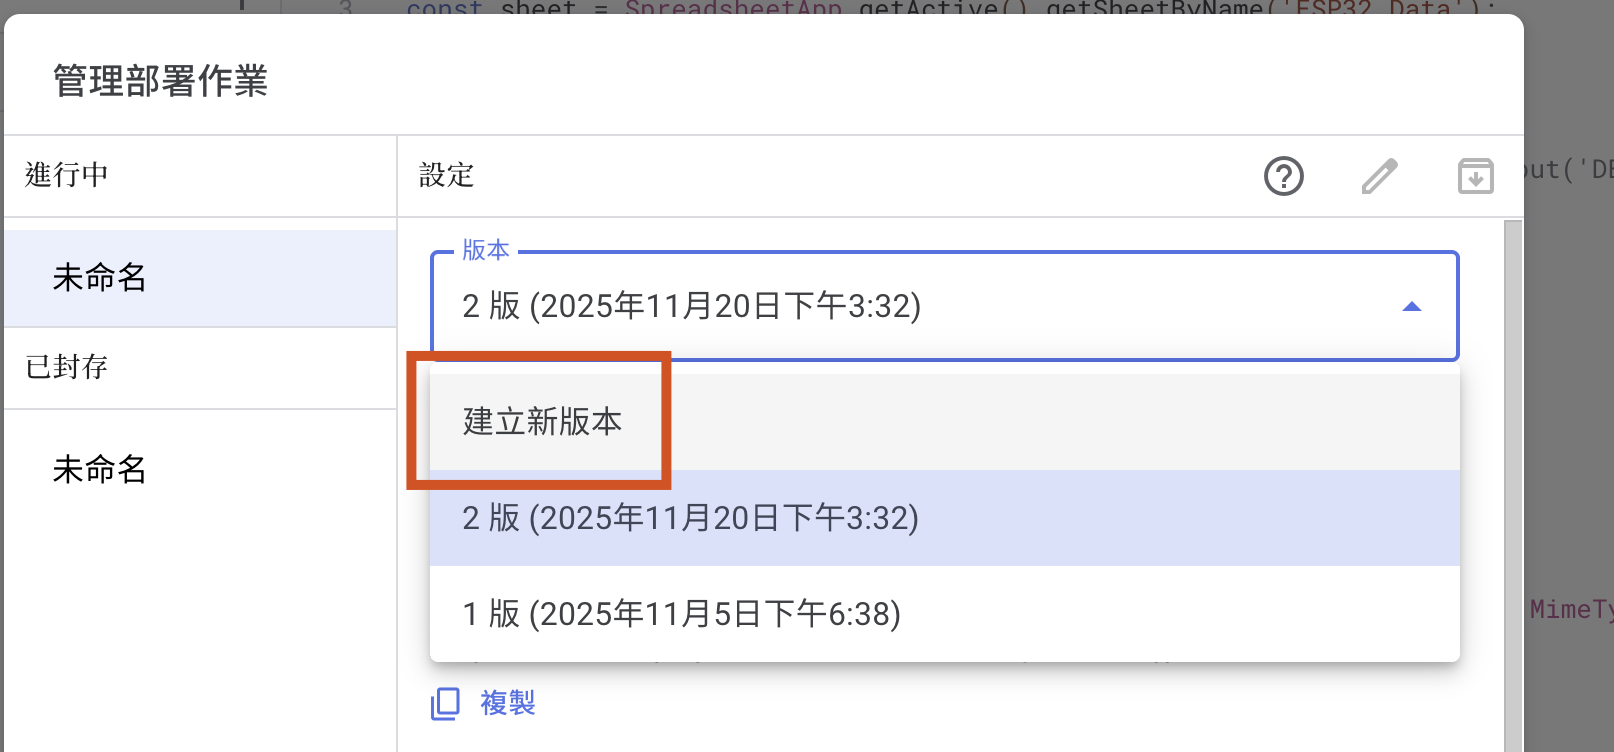
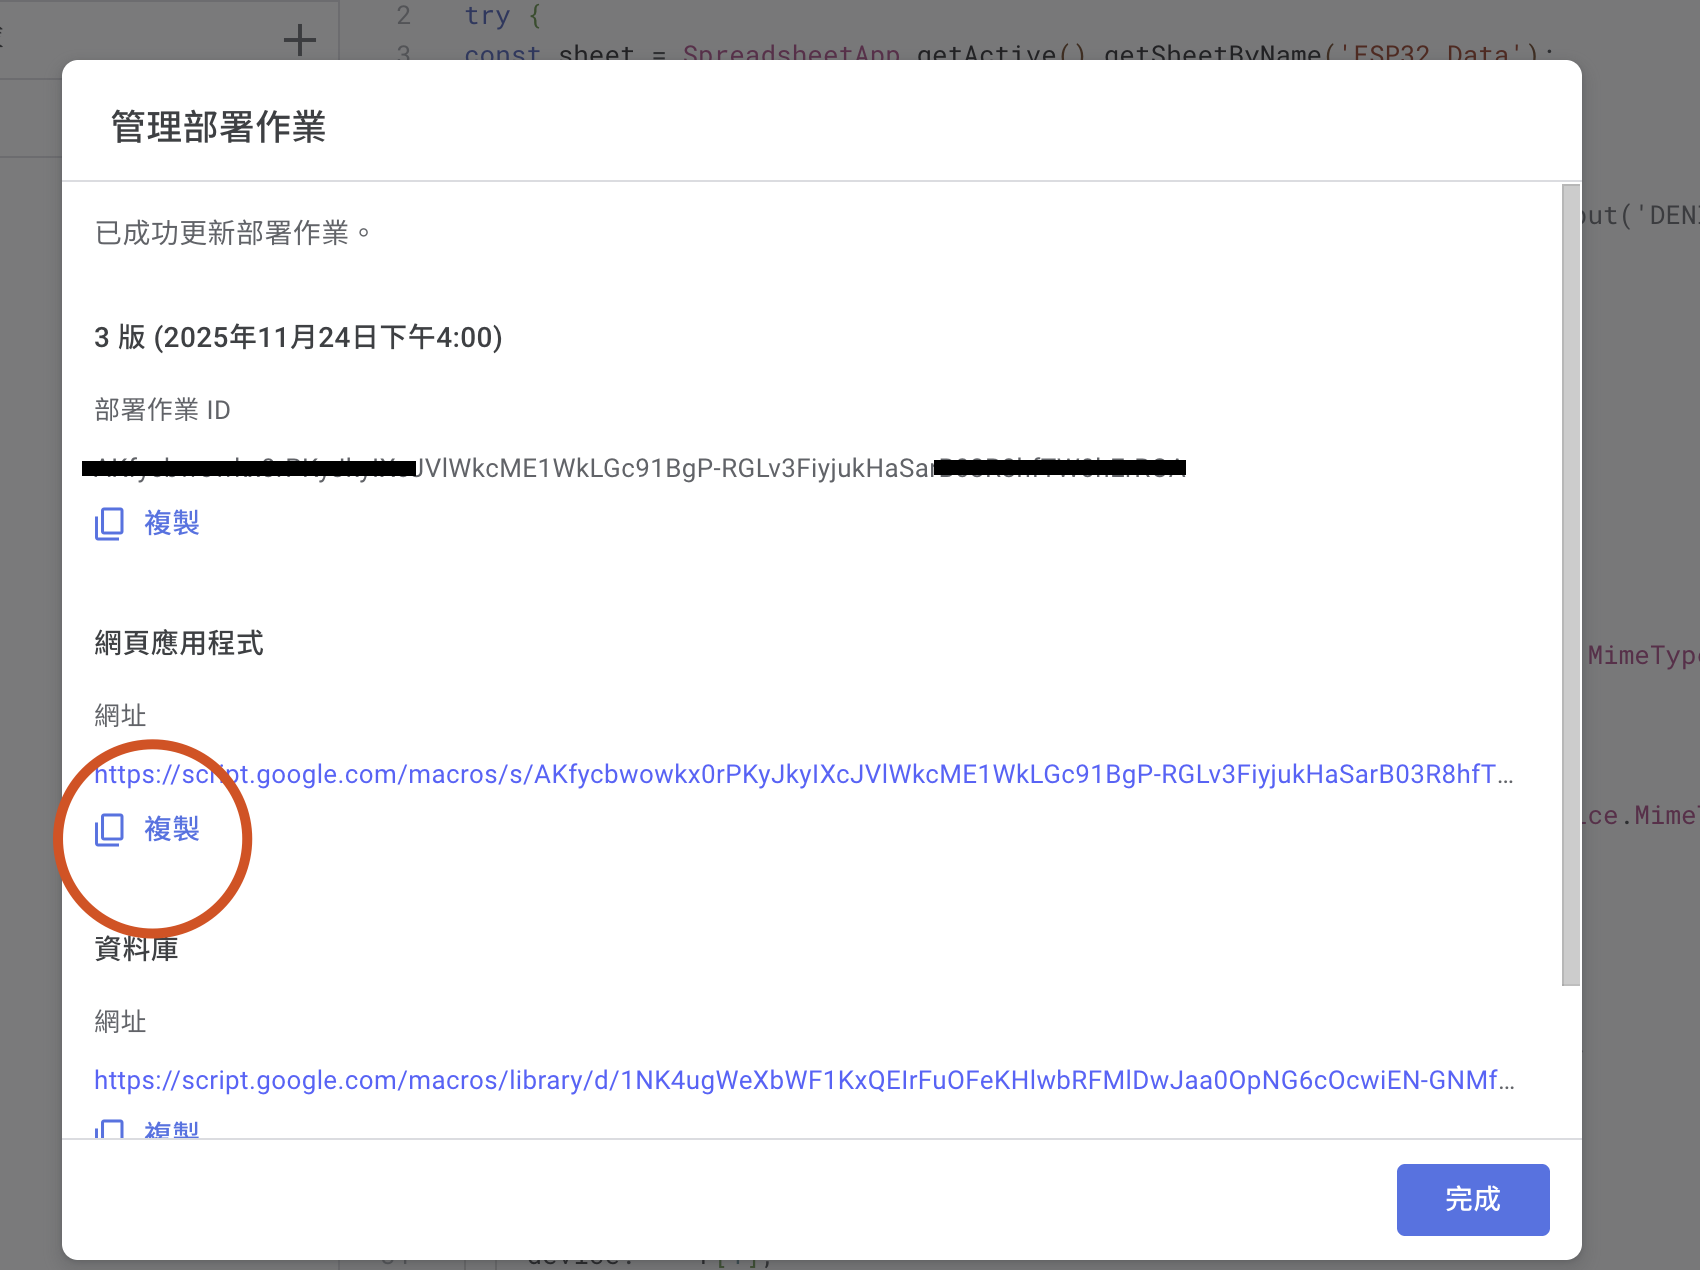
Add this to the front-end script.js:
const url = "YOUR_GAS_URL";

fetch(url)
  .then(r => r.json())
  .then(data => {
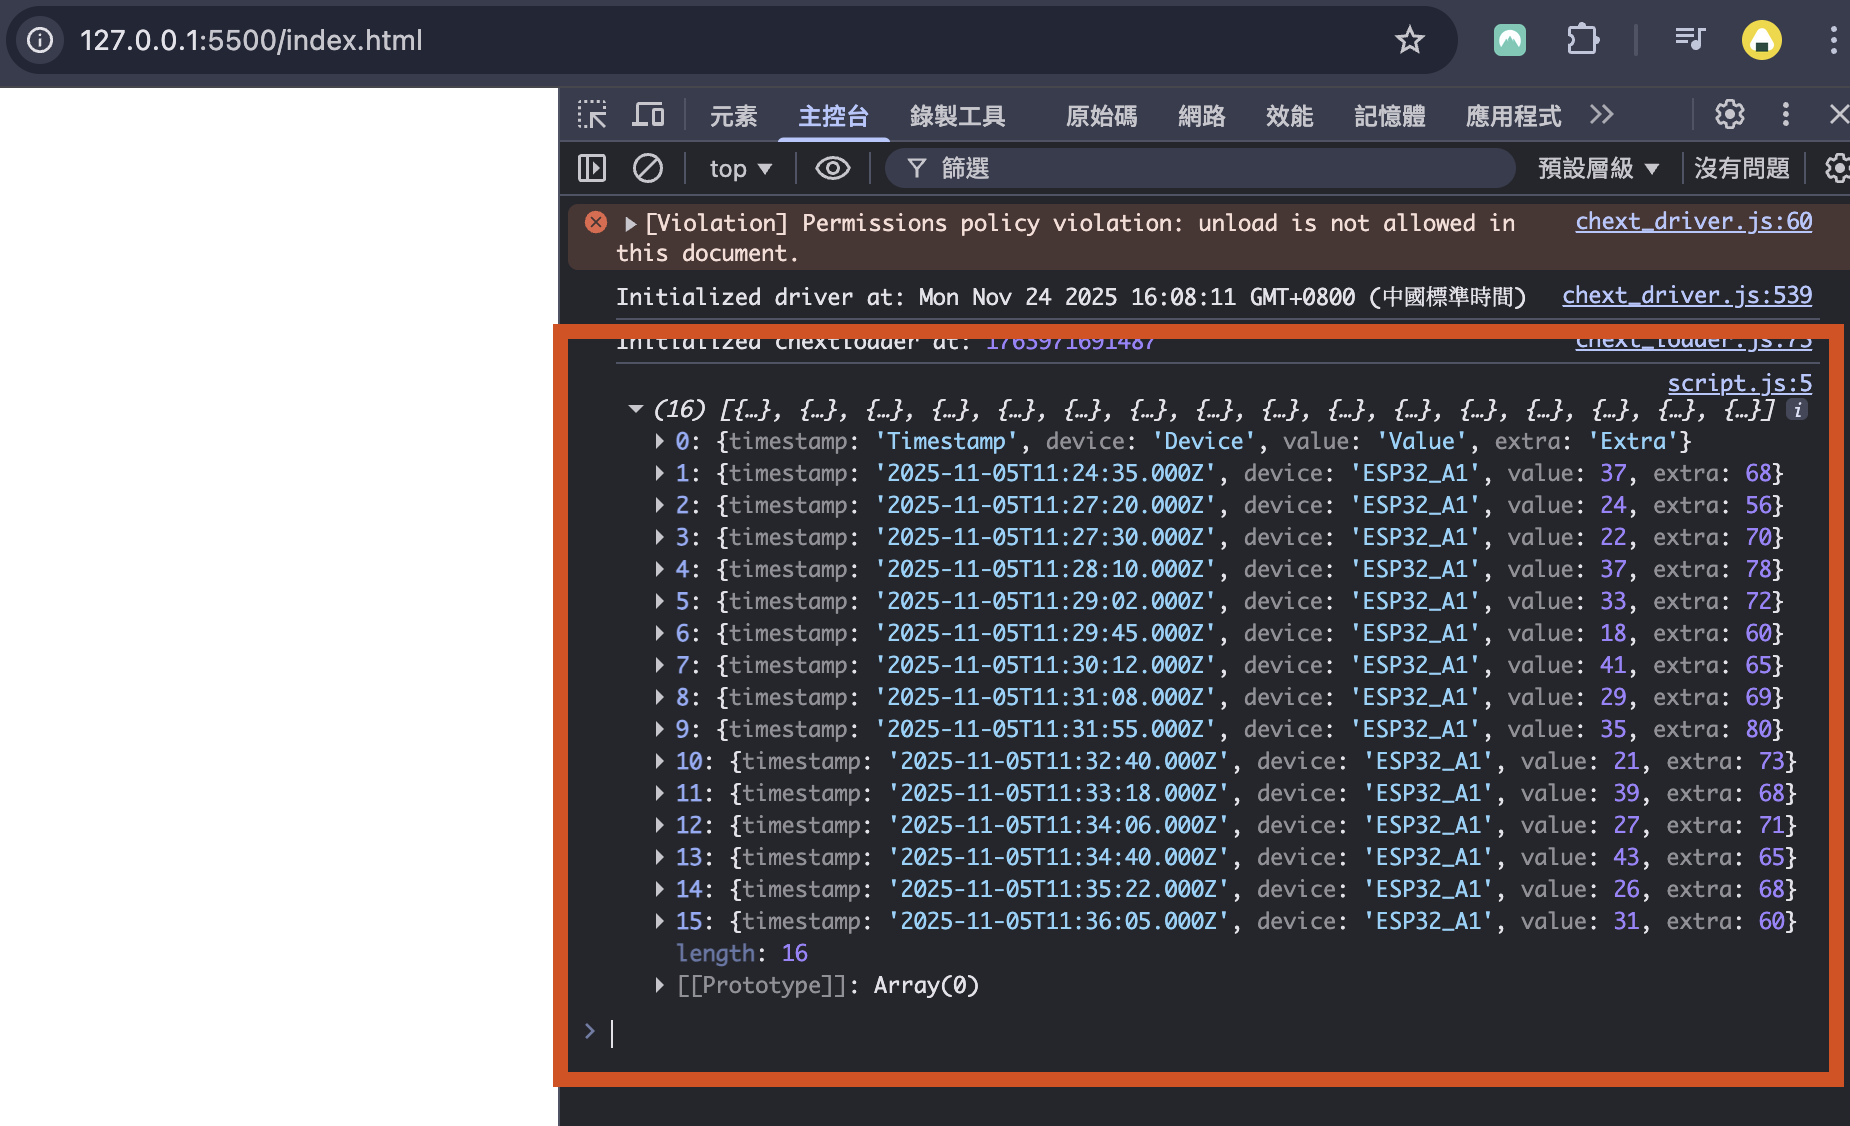
      console.log(data);
});If the data appears in the browser console (F12), you are ready to draw a chart.
6. Plot the Data on the Dashboard
In an AI tool, write a prompt that clearly states the data source, retrieval mechanism, charting library, chart type and refresh requirements.
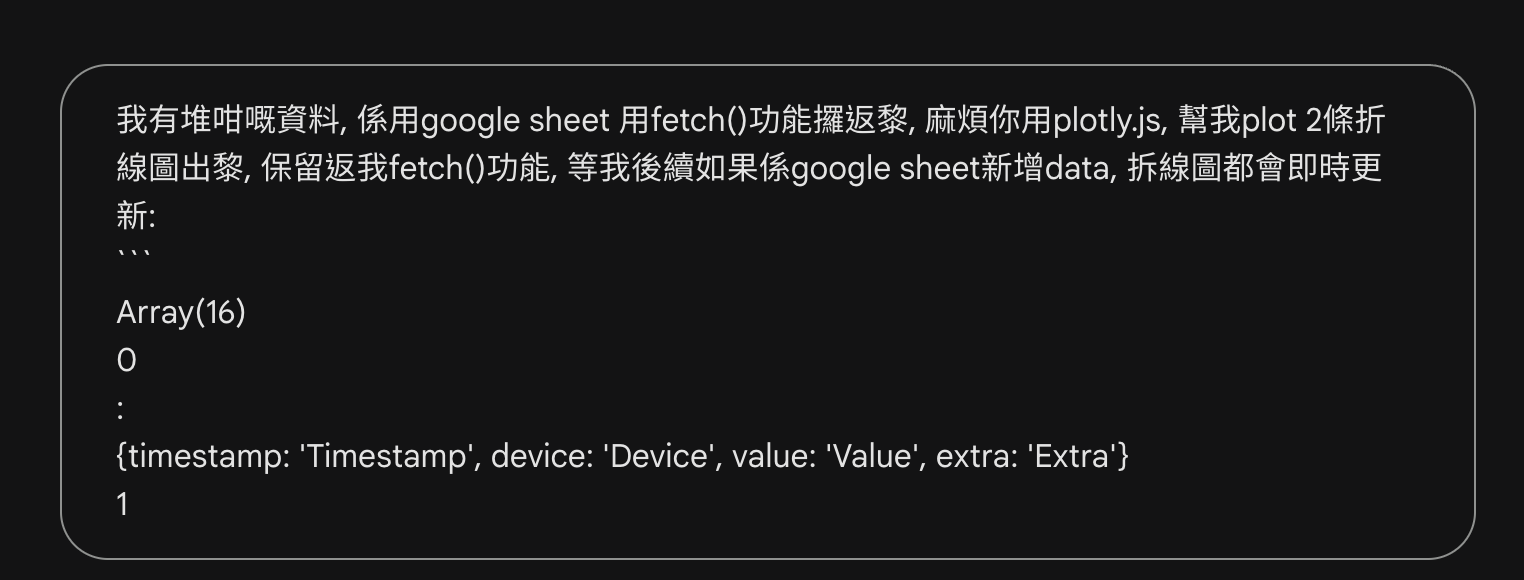
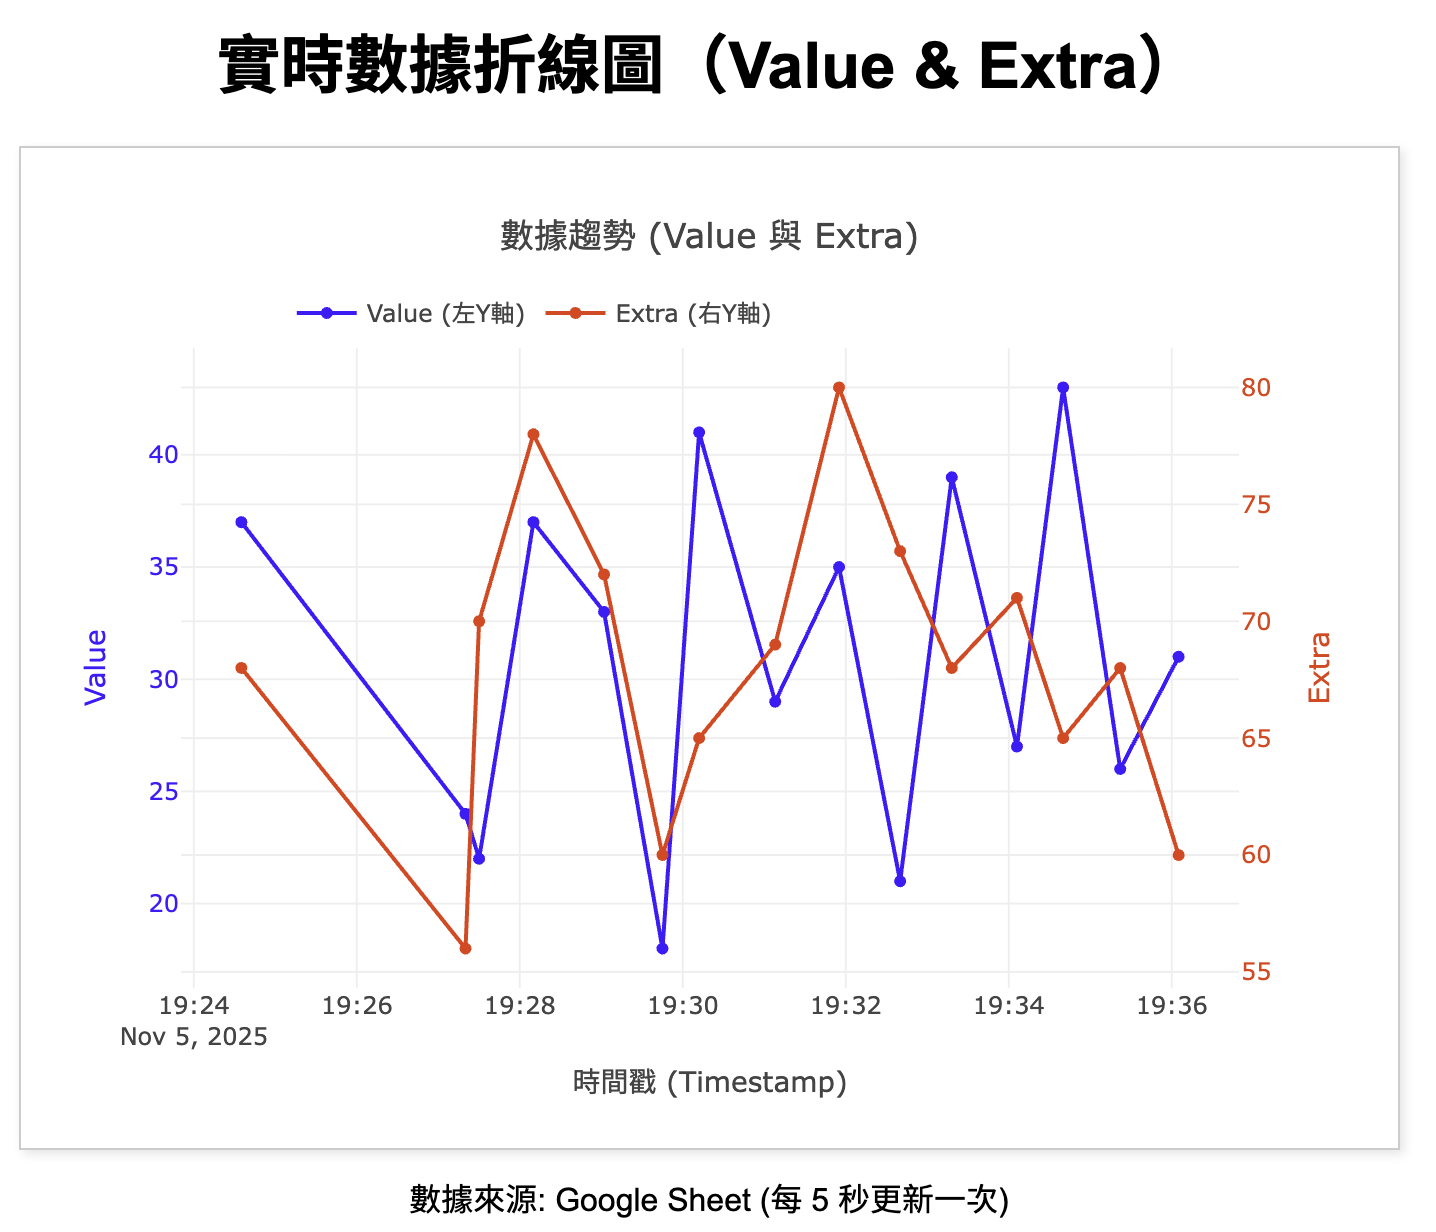
Place the generated result in the front end and inspect it.
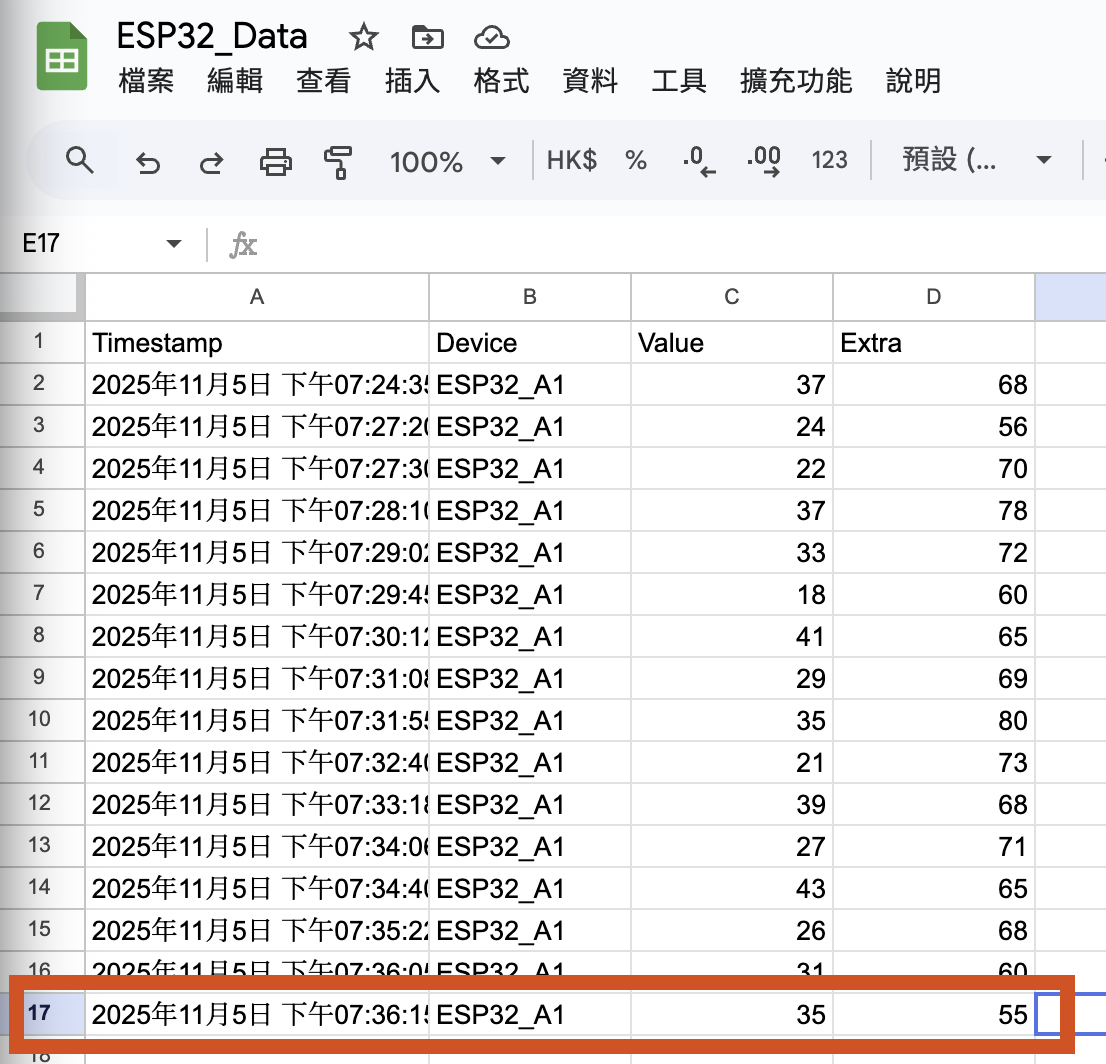
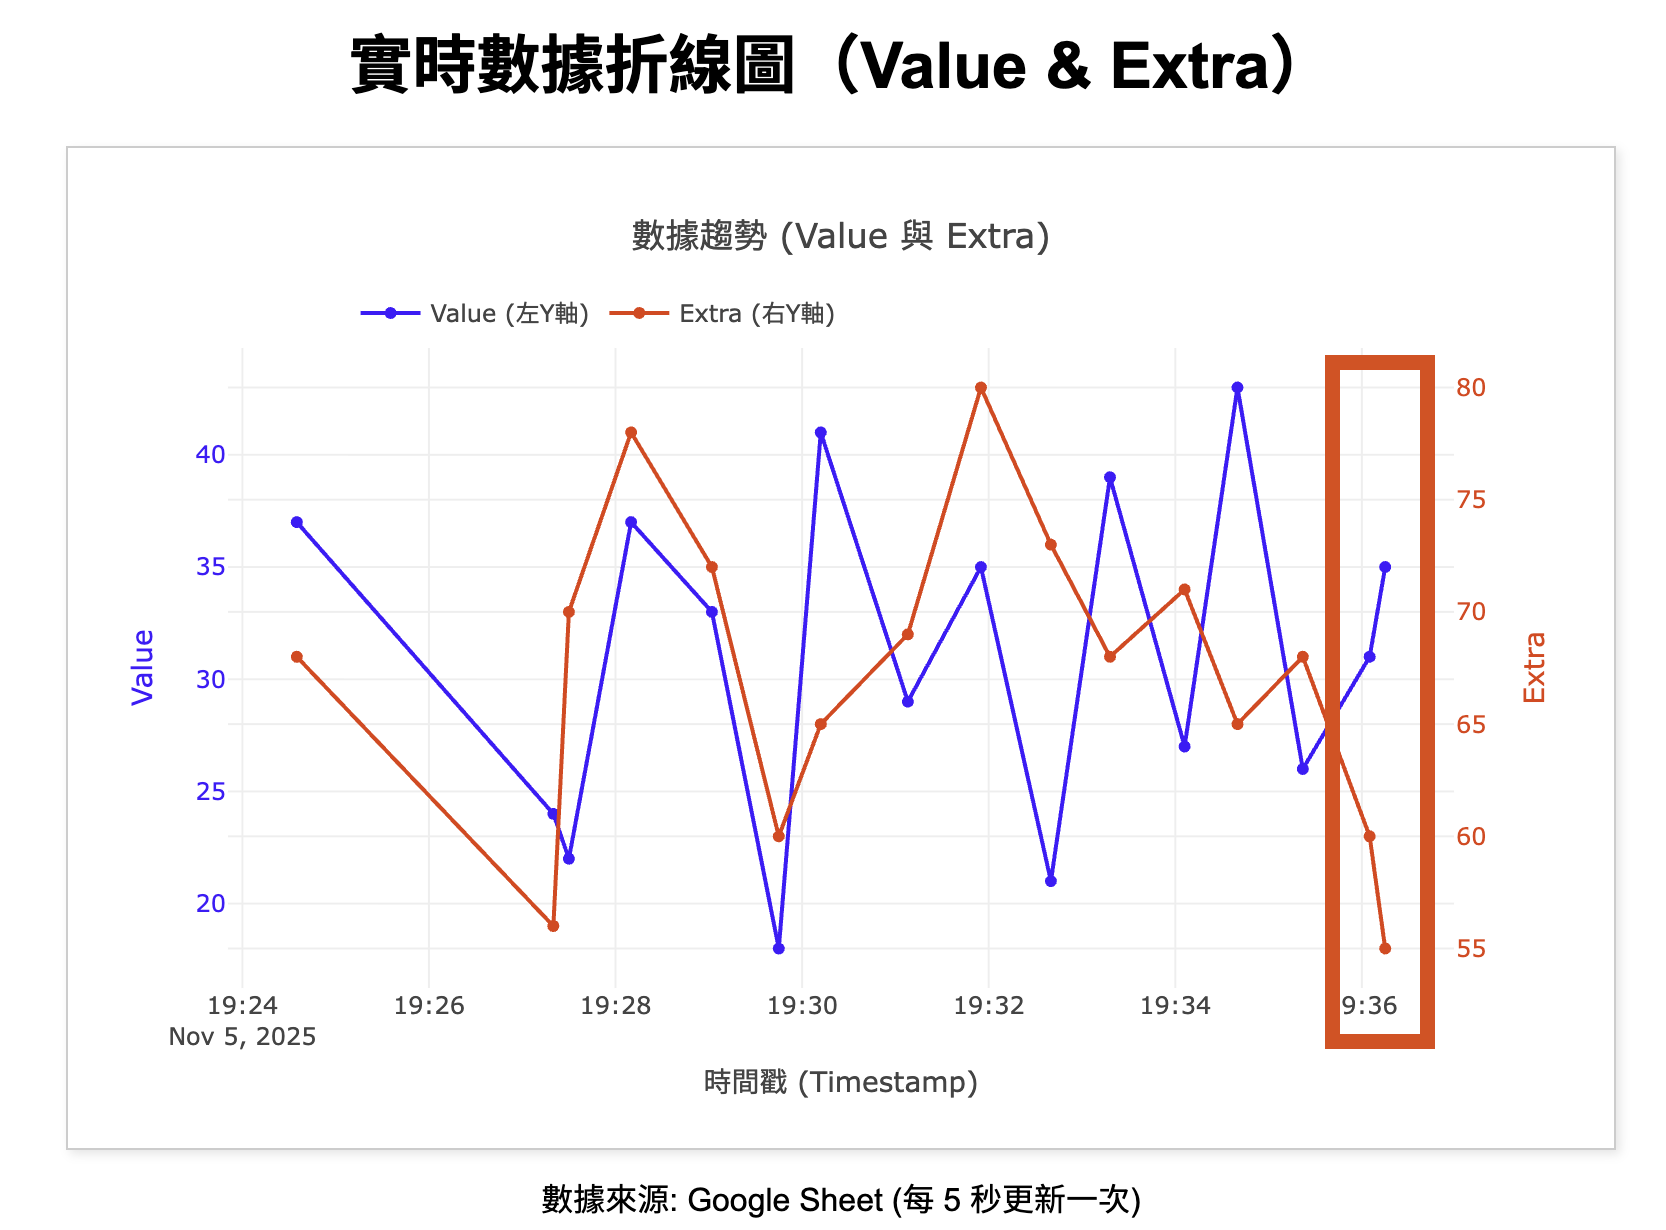
Add data to Google Sheets, wait for the next refresh, and check whether the line chart updates.
Decide whether the dashboard should be a live monitor, a fixed time window such as the most recent hour, or a statistical view using histograms and pie charts. Plotly.js includes many statistical chart types that can produce polished visualisations with very little code.
7. Summary
- Dashboard = HTML for structure + CSS for appearance + JavaScript for data and charts.
- A static host such as GitHub Pages is well suited to deployment.
- The ESP32 itself is a poor dashboard host because of storage and performance limits.
- Google Sheets acts as the data store.
- GAS acts as the API.
- The dashboard uses JavaScript to retrieve and visualise the data.
Translation notice: This English page was generated automatically by AI and has not yet been reviewed by a human. It will be checked and revised page by page when time permits.